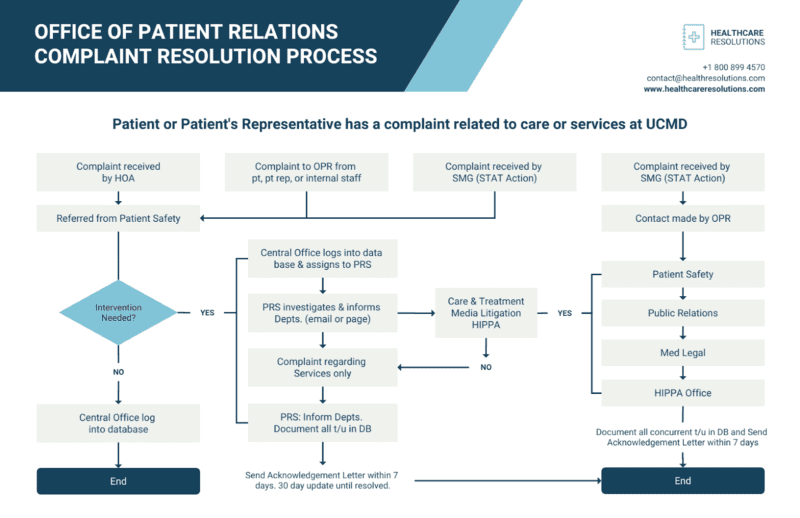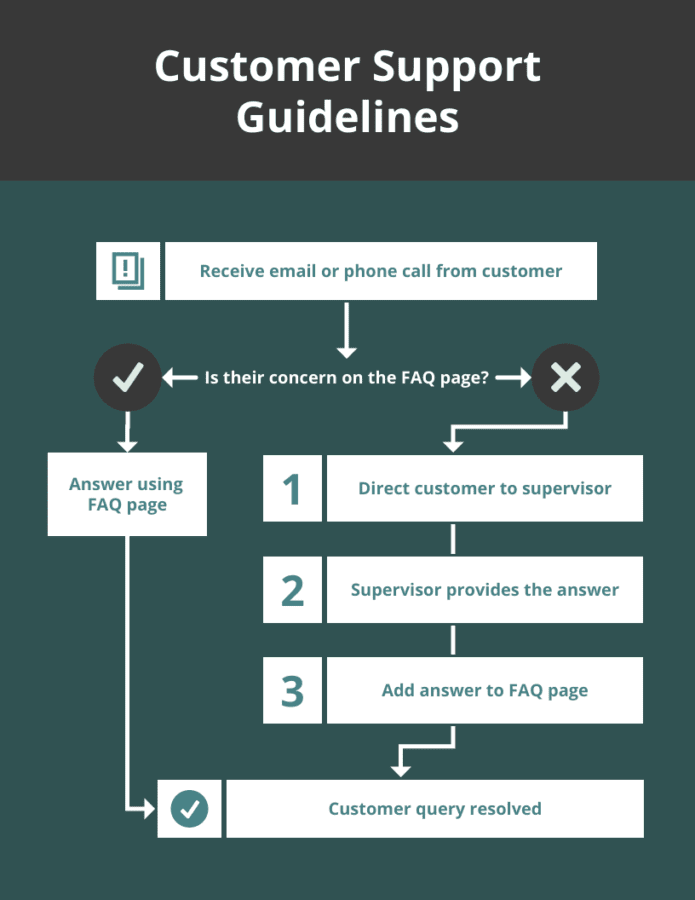
A process flow diagram (PFD) is a flowchart or process map that provides a graphical representation of a certain process. It depicts process activities as boxes or circles or indicates what happens at each step. It illustrates the sequence of process steps and how they are related to one particular process.
Also usually called process flow charts, process flow diagrams can be used to document existing processes or improve future process performance. They can also identify process bottlenecks, point out areas where errors occur, and help promote continuity within operations as well as the smooth transfer of information between departments. Process diagrams usually detail business process flows from start to finish, including process steps, decision points, and process outputs.
Discussed below are the benefits of having a process flow diagram:
1 Process flow diagrams can be used to improve process integration.
When processes are not integrated, it may cause the company to fail in achieving its goals. This is because process outputs do not line up with each other, or some processes are handing off tasks to another department which means that there is no one overseeing the process. Creating a process flow diagram will help you see where this kind of thing happens so you can fix it before your organization runs into any problems.
2 Process flow charts help identify waste and bottlenecks in processes.
Bottlenecks are when nothing moves on within a process, or something stops progress from being made on tasks within the process altogether because only one person is doing all of the work while everyone else sits around waiting. This process flow diagram helps you identify these issues so that they can be addressed, and your process will work smoothly again.
3 Process flow diagrams are beneficial for process improvement.
When processes are not improved on or worked on after they have been completed, it can lead to them becoming obsolete in some ways. A process flow diagram may show you parts of your process that would benefit if they were modernized in some way, which could help with process efficiency in the future when changes like this are made.
4 Process flow diagrams help enhance communication between individuals doing tasks within a process.
A process flow diagram may look like steps on how to do something, however, when everyone involved understands what the time frame is for things within the process, it can help them know what they should be doing at a certain time to make the process flow smoothly.
5 Process flow diagrams help you see how a process flows from one process to the next if multiple processes are required within a process.
This will help with process integration because processes can be connected in ways that contribute to being able to hand off tasks or hand over individual parts of tasks from one process to another. This type of organization is very helpful when dealing with things like projects which require different departments and other organizations involved so each person knows what their role is within the project.

Venngage
6 Process flow diagrams allow for both internal and external customer analysis while identifying points where feedback loops occur.
Feedback loops are when a process has no way of knowing how it is doing, or what can be improved on. A process flow diagram will show you where these loops exist so that process evaluation and process improvement can take place in the right areas to help your process run more smoothly.
7 Using the proper flow chart example can be used to identify process problems and improve process efficiency and effectiveness.
This is done by replicating other process flowcharts that shows each step of a process, and then evaluating it to see where things can be done more efficiently, or if there are any bottlenecks within the process at all which may make starting over with a new way for this task or process helpful especially when dealing with complex processes such as projects.
8 Process flow diagrams help define roles and responsibilities for individuals involved in a task, which helps with process integration.
This process flow diagram will show the process step by step so that each individual involved in this process can understand what they are responsible for, or where process handoff between individuals within the process happens. This is helpful because it gives everyone who is part of a process an idea of their role, and how the process impacts them along with other processes so they know what to do next when things change up.

Venngage
9 Process flowcharts can help organizations become more innovative within process design.
This is done by being able to analyze your processes which may allow you to find new ways to complete tasks that you have already completed in the past under a different circumstance or something that has always been done one which can be reworked into something much more efficient.
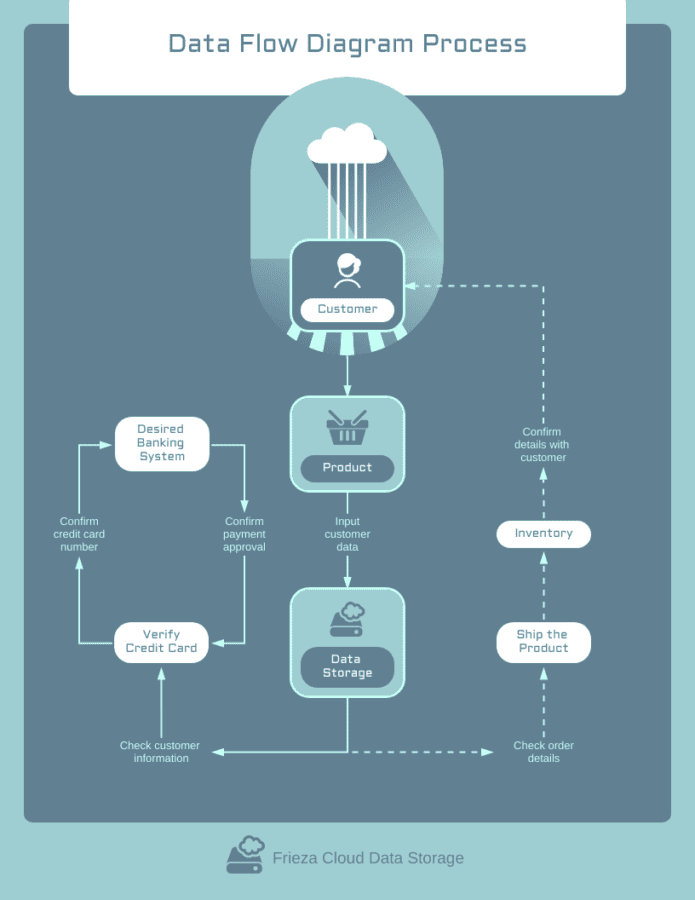
10 Data Flow diagram shows the flow of data through an information system
Closely related to a PFD is the data flow diagram (DFD). A data flow diagram (DFD) is a graphical representation of the flow of data through an information system. It shows how the system works, what happens to the data, and where the data comes from and goes to.

Venngage
If you are ever in need of creating your own process flow diagram, give Venngage a try. It’s an easy-to-use tool that makes it simple to visualize your data. With Venngage, you can choose from over 100 templates and customize them to fit your needs or create your own design from scratch. Plus, there are millions of icons and images at your disposal, so you can really make your work stand out. Sign up for a free account today and start creating beautiful process flow diagrams like the ones shown in this post!


